What is Compound Interest?

Everyone knows what interest is. It’s when you buy something on your credit card, and then over the course of a year, end up paying way more for it than the price tag said.
But how awesome would it be if you could be the one making that money, instead of losing it? In this post, I’ll explain how that same idea of interest can be used in order to make passive income.
Most interest bearing accounts work on a principle of compound interest. This includes savings accounts, some checking accounts, and stocks with reinvested dividends. The beauty of compound interest, is that as time goes on, not only do you earn interest. You also earn interest on the interest earned previously. This is where the word compound comes from.
The compound interest formula is given as A=P(1+rn)nt
Example One - Single Contribution
Let’s say you make a single $100 deposit, and are earning 10% interest on the account. After 1 year, you earn $100 x 10%, or $10. The second year, you earn another $10 on the initial deposit, but also interest on the $10 earned from the first year. This additional interest is equal to $10 x 10% or $1. So the total earned after two years is $10 + $10 + $1 or $21, for a total account value of $121.00.
In order for this to work, any money earned must remain in the account. If you start withdrawing interest early, your potential profit starts going way down.
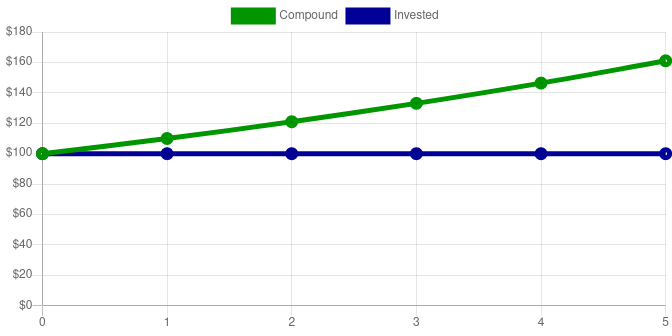
Here is a graph and chart of the first five years. This is assuming the money is left untouched in the account:
| Years | Contribution | Total Invested | Value |
|---|---|---|---|
| 0 | $100 | $100 | $100.00 |
| 1 | $0 | $100 | $110.00 |
| 2 | $0 | $100 | $121.00 |
| 3 | $0 | $100 | $133.10 |
| 4 | $0 | $100 | $146.41 |
| 5 | $0 | $100 | $161.05 |
| … | … | … | … |
| 50 | $0 | $100 | $11,739.09 |
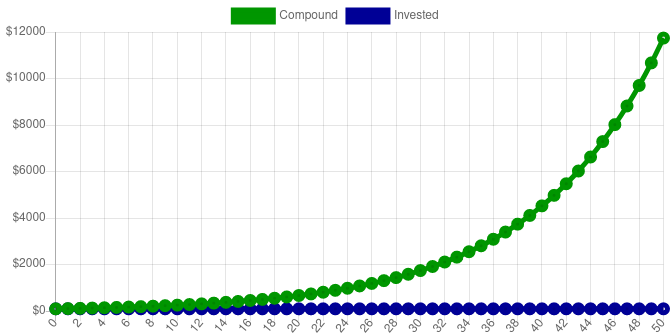
So at the end of 5 years, the account is worth $161.05, but only $100 was invested, for a $61.05 profit. It’s hard to see with such a limited time frame, but there is a slight curve to the chart of compound interest.
I’ve zoomed out on the chart above, in order to show the what happens after 50 years. The account value is now $11,739.09. You can see the new 50-year chart below. Notice how as time goes on, the money is increasing faster, and the graph has an upward curve towards infinity. This is called exponential growth.
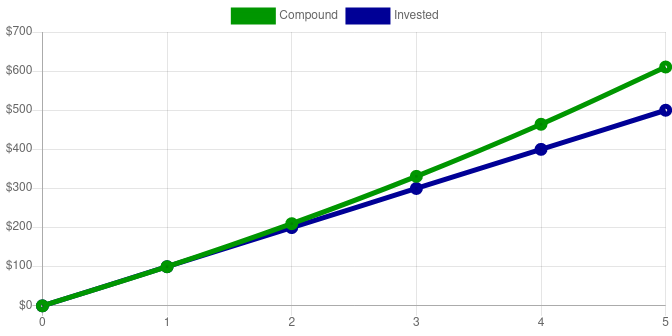
Example Two - Regular Contributions
A much more real world example, includes continuing to contribute every year. This causes the slope of our invested line to go up, which can only serve to increase the compounded value even more.
| Years | Contribution | Total Invested | Value |
|---|---|---|---|
| 0 | 0 | 0 | $0.00 |
| 1 | $100 | $100 | $110.00 |
| 2 | $100 | $200 | $231.00 |
| 3 | $100 | $300 | $364.10 |
| 4 | $100 | $400 | $510.51 |
| 5 | $100 | $500 | $671.56 |
| … | … | … | … |
| 50 | $100 | $5,000 | $116,390.85 |
Even though only $500 was deposited, after 5 periods, the account is worth $671.56. That’s a $171.56 profit. It’s important to note that even though more money was invested in this second example, the total profit after just 5 years was more than double the $61.05 profit from only doing one deposit.
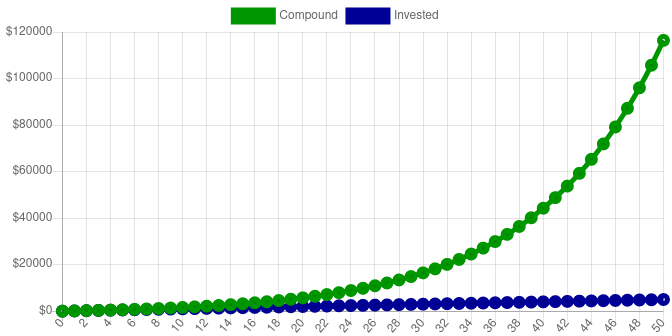
Zooming out once again to 50 years, we can see the shape of the charts exhibits a similar exponential growth, however the final account value is $116,390.85.
Conclusion
It should be clear, that investing more money, and/or waiting a longer period of time before withdrawing, will lead to more money being earned. There are many wealthy individuals who eventually earn a yearly interest so large, that they are able to comfortably live off it, without having to work.
In an upcoming post, I’ll be going a little deeper into explaining how to build wealth using this method of compound interest. I’ll be giving some ideas for where to invest your money, and show how anyone can become a millionaire.